Monitoring BOP Components

Here's how to monitor the degradation of components on a blowout preventer (BOP).
Basics
When you open the app, you will see the following page:
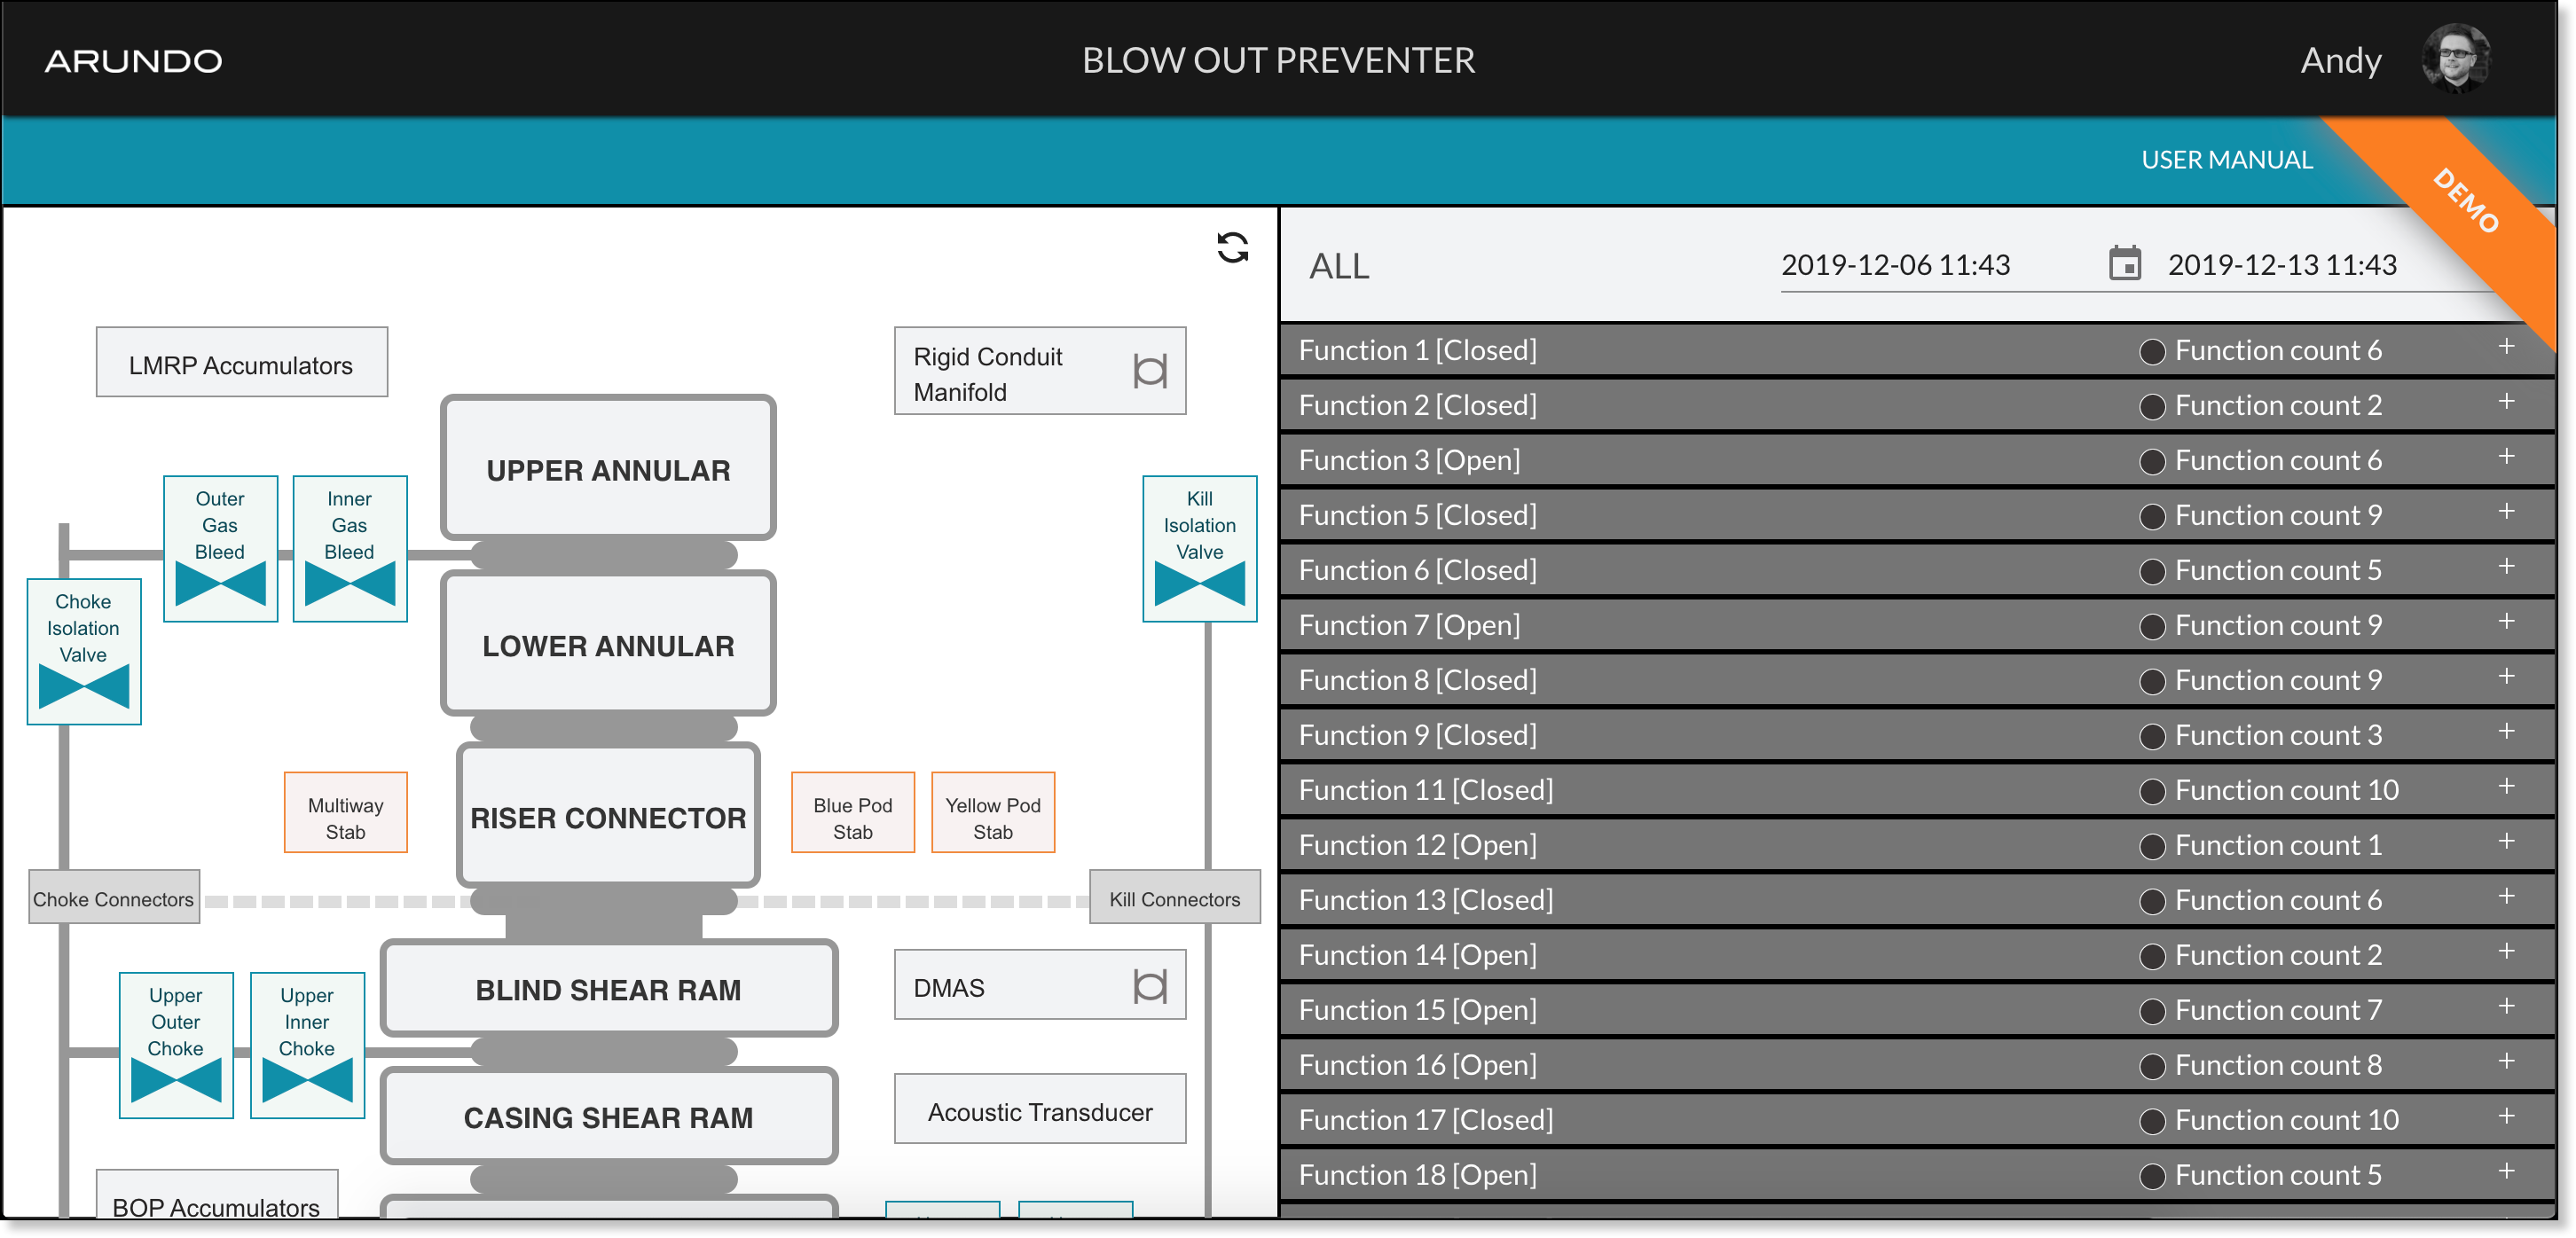
This page is separated in two main areas:
Blowout Preventer Diagram
The Blowout Preventer diagram is an interactive schematic of the BOP.
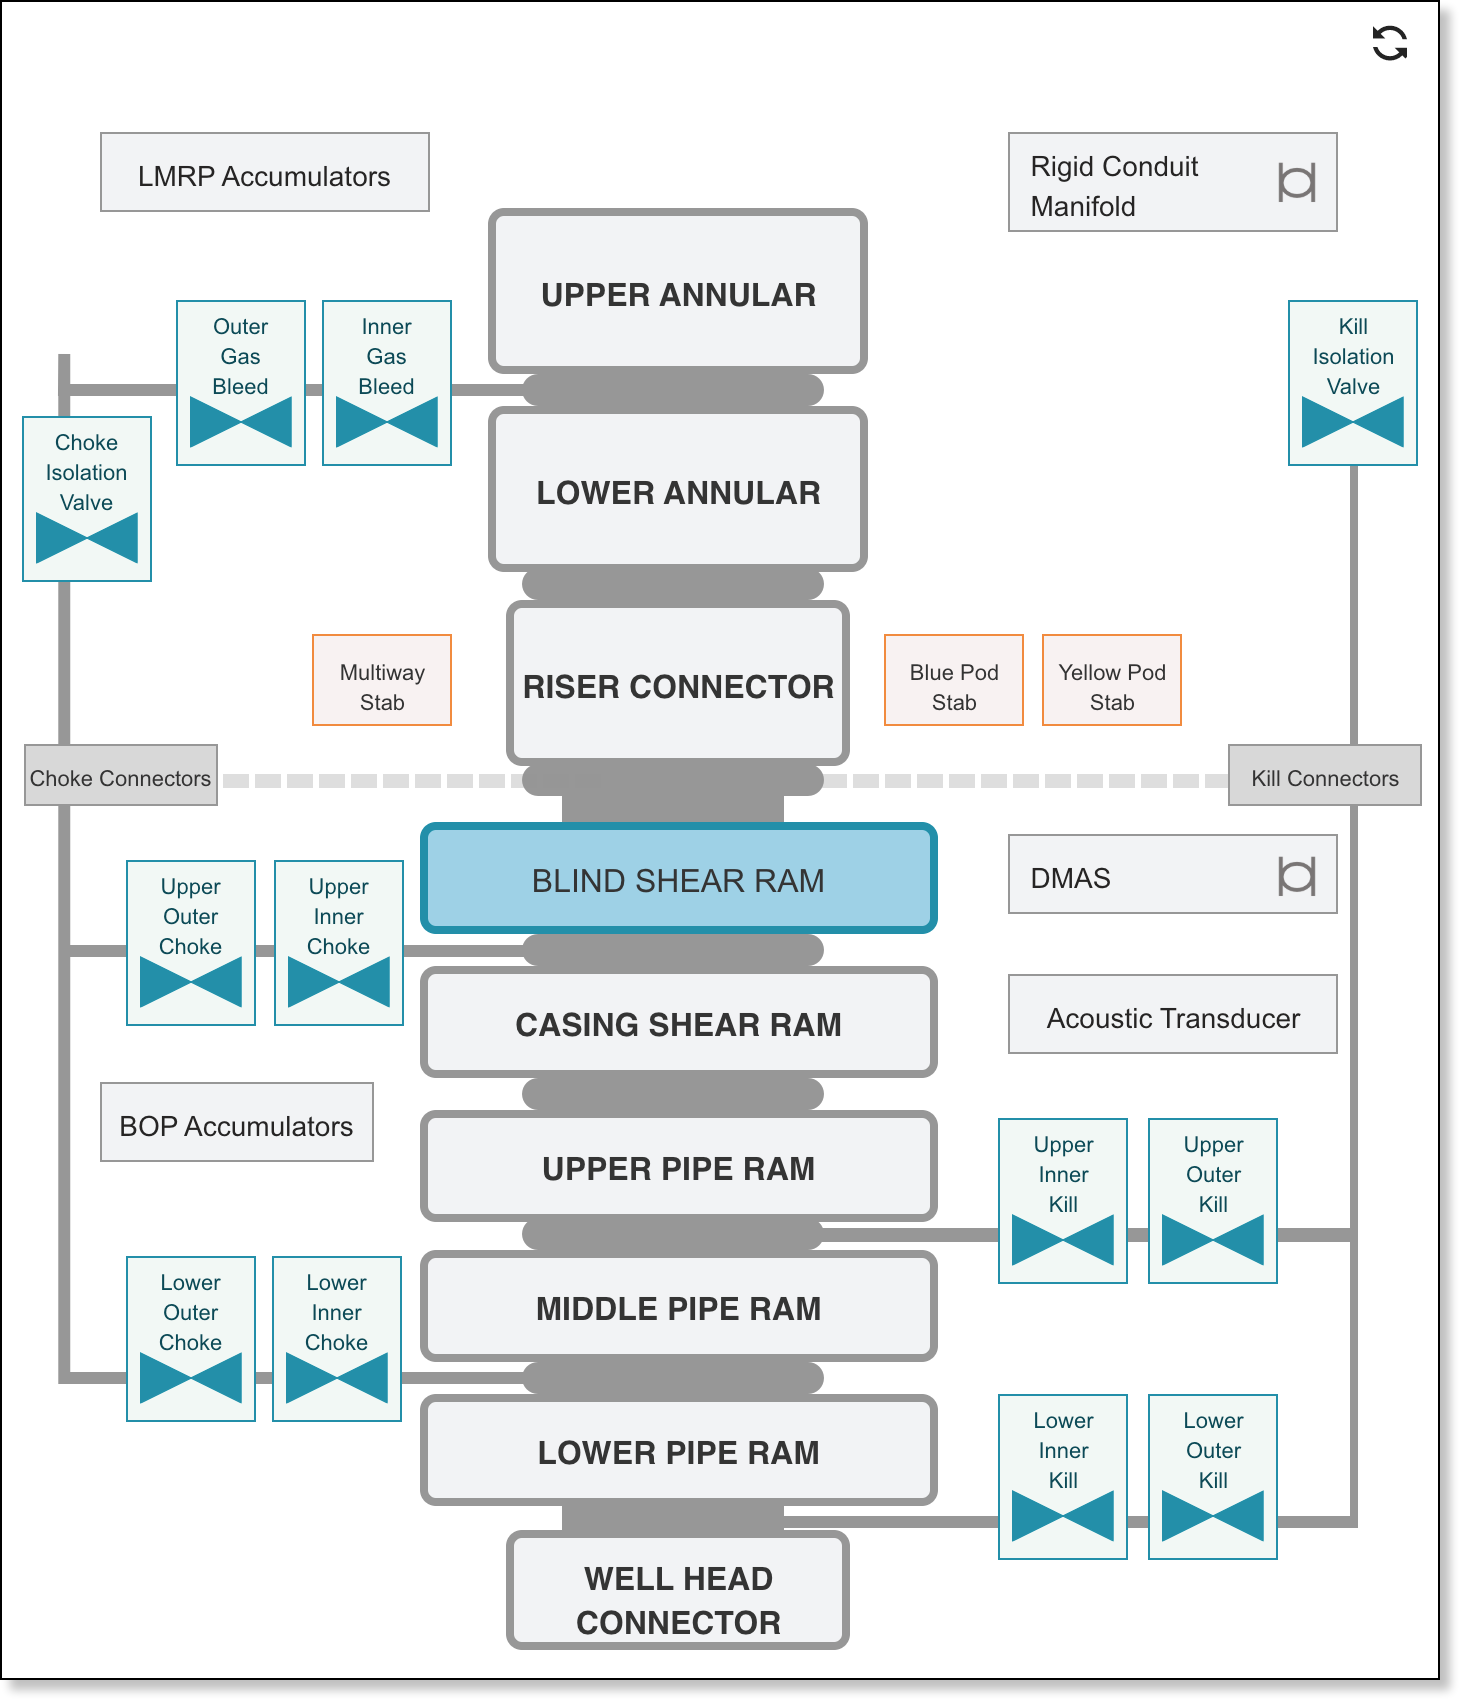
When you select a component on the diagram, the function cycles that ran during the specified date range display on the right side of the page. This gives you the ability to estimate equipment degradation.
Function List
The Function list displays the function cycles that ran during the specified date range.
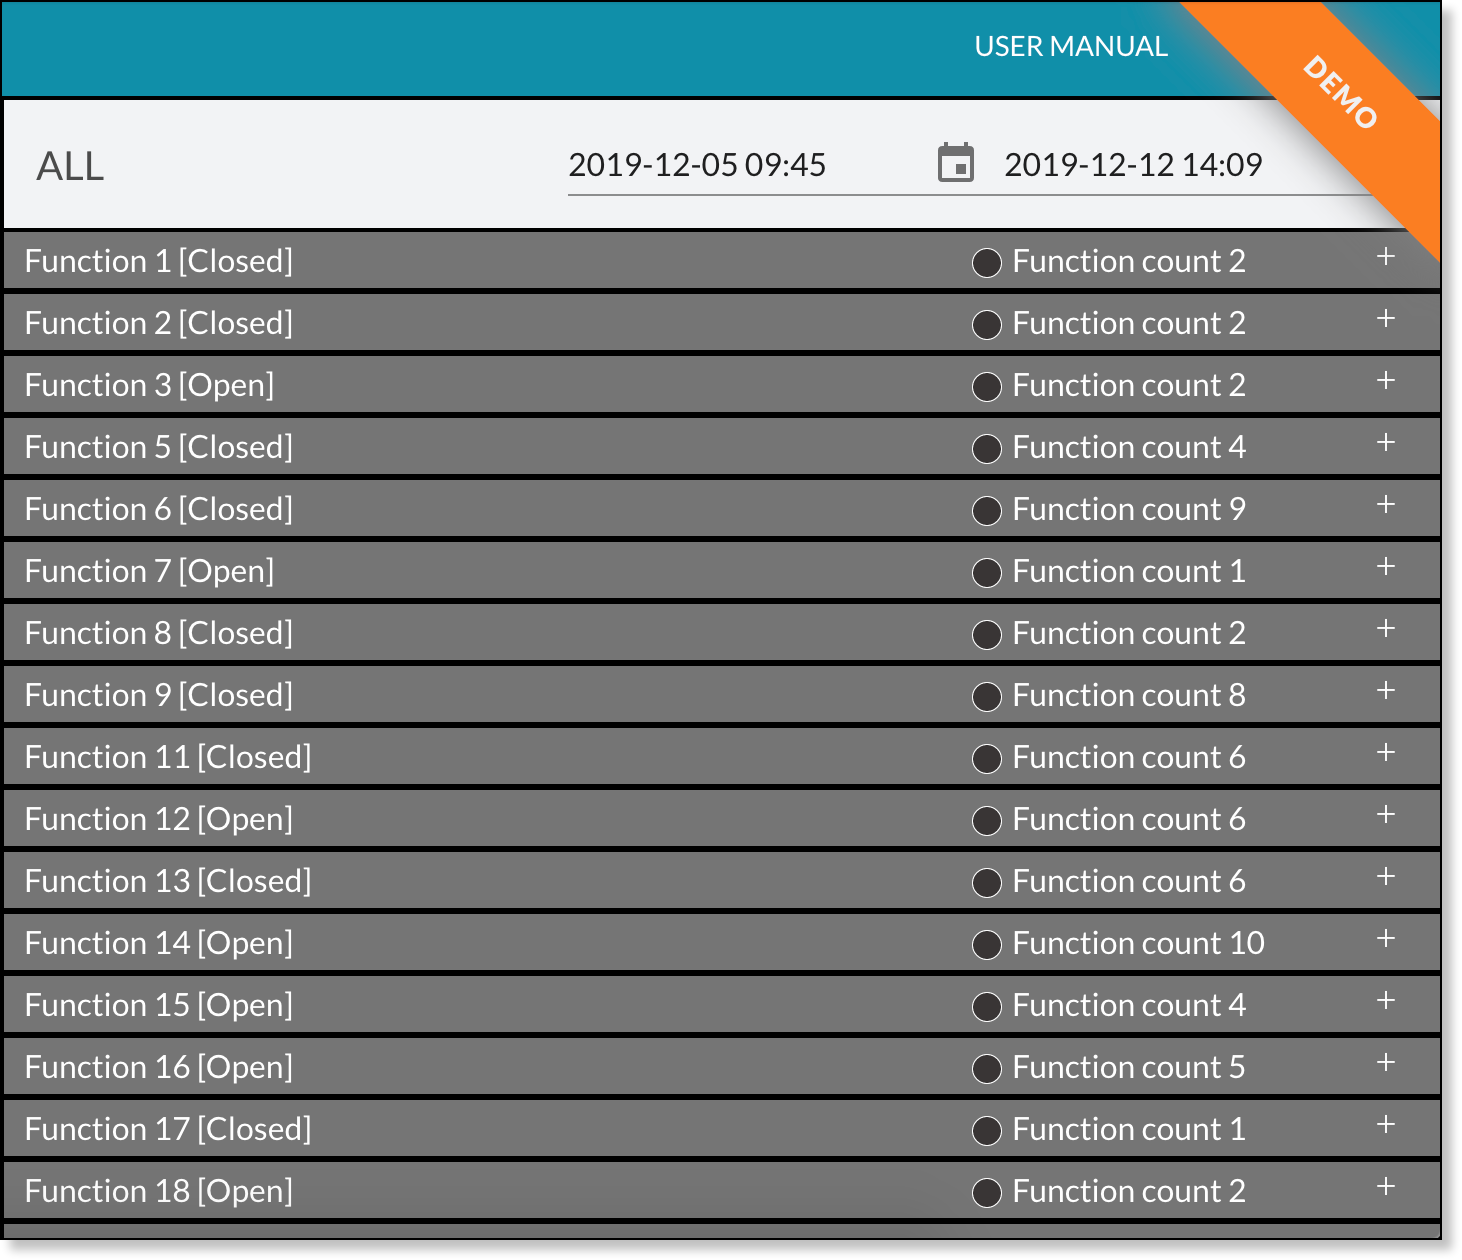
The function cycles for all components of the blowout preventer display by default. When you select a component on the Blowout Preventer diagram, the list changes to show the function cycles for that specific component.
Tip
Use the Date Range controls to adjust the dates and times for which to view activity.
Select a function cycle in the list to view detailed information about it.
- The state displays after the function ID and can either be
[Open]or[Closed]. - The function count is how many times the function ran during the specified date range.
Function Details
When you select a function cycle in the list, you can see detailed information for each component activated during the cycle, including the functional location and cycle count.
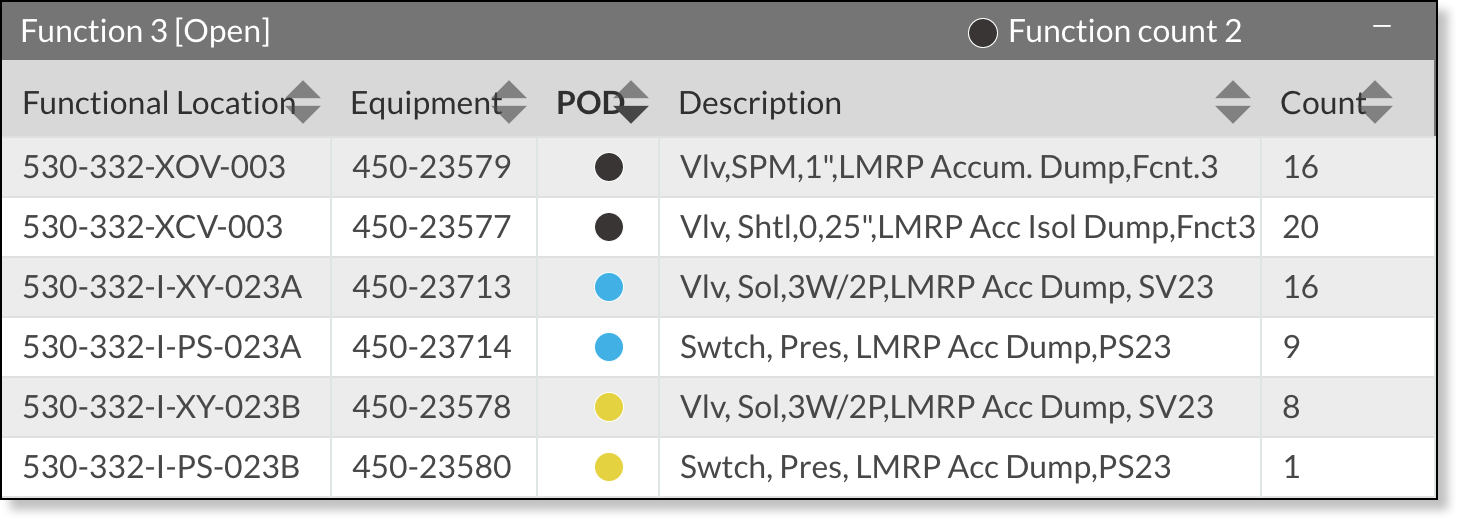
The following information displays for each component activated during the cycle:
| Field | Description |
|---|---|
| Functional Location | ID for the functional location of the component |
| Equipment | Serial number for the component |
| POD | * Gray indicates the component was activated in both control PODs* Blue indicates the component was activated in the blue control POD* Yellow indicates the component was activated in the yellow control POD |
| Description | Name of the component |
| Count | Number of times the component was activated during the function cycle |
Tip
Hover the mouse over the Equipment field to view further details, including the component's installation date and usage.
Monitoring a Specific Component
Here's how to monitor the degradation of a specific BOP component.
- On the Blowout Preventer diagram, select the area to analyze.
- Adjust the Date Range controls to select when to view function activity.
- Click a function cycle in the list.